Predictive Data Analytics with Python
Course Description
In this 30-hour hands-on course trainees learn how to read, clean, visualize and analyze data effectively using Python and its powerful free libraries Pandas, Seaborn, Scipy, Numpy, Matplotlib, and Statsmodels. They also learn how to interpret the results and use them to make predictions.
Prerequisites
This course has Python Fundamentals as a prerequisite.
Learning Outcomes
Trainees will be able to:
- Import data from CSV files and clean data.
- Enter data into Pandas data frames, manipulate data frames.
- Calculate variance and standard deviation.
- Visualize data using scatterplots.
- Use Seaborn to display the regression and residual plots.
- Discuss the residual plot as part of regression analysis.
- Make predictions based on the results of simple linear regression analysis.
- Display boxplots with Seaborn and interpret them.
- Plot histograms with Pandas.
- Calculate the Pearson coefficient of correlation R (R-value).
- Visualize correlation graphically via heatmaps.
- Describe the purpose of using the R-squared value, and its advantages over the R-value.
- Distinguish between continuous, discrete and categorical random variables.
- Calculate the P-value and the standard error of the estimate using Scipy and interpret the results.
- Interpret data using the statistical hypothesis testing and the null hypothesis.
- Use training and testing datasets to make predictions.
- Perform multiple linear regression using Statsmodels.
- Make predictions based on multiple linear regression.
- Evaluate variable independence in multiple linear regression based on multicollinearity.
- Perform logistic regression with Seaborn and Statsmodels.
- Recognize when the results of logistic regression are wrong.
Equipment Requirements
Computer, laptop or tablet with Internet access, web browser, and email.
Course Structure and Length
The course is self-paced, and trainees practice each skill or concept as they go. Automatic feedback is built into the course for both practices and quizzes.
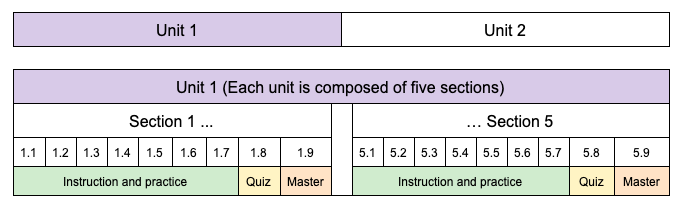
The course is one Unit divided into five Sections. Each Section consists of 7 instructional/practice levels, a quiz, and a master (proficiency) level. Trainees can return to any level or quiz for review.
While learning skills in this course, trainees can practice queries and create portfolio artifacts with NCLab’s Python apps. They can use a project idea from NCLab or create their own. This independent practice develops their fluency and confidence as data analysts and programmers.
The time to complete this course is approximately 80 hours. Since the course is self-paced, the amount of time required to complete the course will vary from person to person. Trainees are responsible for learning both the tutorial content and the skills acquired through practice.
When taking this course as part of Data Analyst Career Training Program, at the end of this course, trainees complete a Capstone Project under the supervision of a Data Analytics instructor in order to graduate and obtain a career certificate.