Although this is not a typical Turtle activity, today we will plot the graphs of functions! Moreover, we will add some colors and 3D to it, and also spice it up with a bit of computer programming. Turtle Tina in NCLab is an excellent tool for that. You don’t even have to create a user account or log in – just visit the Free Portal and launch the Turtle App. Here is a simple program that will make Tina plot the graph of any function f(x) in the interval (a, b):
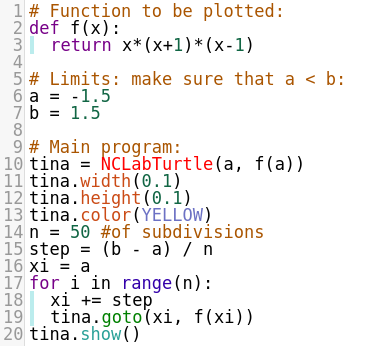
Here is what the program does: On lines 2-3 it defines the function to be plotted, and on lines 6-7 the plotting limits. On line 10, it creates a new NCLabTurtle named “tina” at the position (a, f(a)) – that’s exactly where the graph begins. On line 14 it defines a subdivision. What’s that for? The graph will be a sequence of short linear pieces. Recall that Tina can only walk straight and turn. That needs to be enough to plot the graphs. On line 15 it defines the step – this is the size of the x-axis increment. Lines 17 – 19 are a Python loop where Tina will make n steps of length “step” on the x-axis, and always plot the short line that she just drew. On line 20 she will display the graph. That’s it!
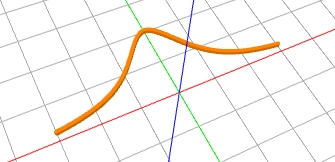
The cool thing is – you can change anything in the program including the function to be plotted, the limits, the subdivision, the thickness and height of the 3D line, and the color of the graph. And you can print the graph on a 3D printer if you want. Here is the graph of the function f(x) = x(x+1)(x-1):
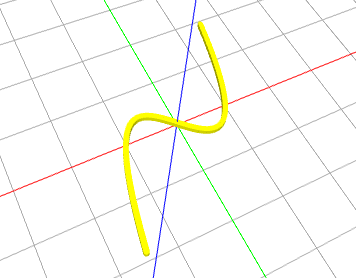
Here is the graph of (10 – 0.1x^2)sin(x) in the interval (-10, 10):
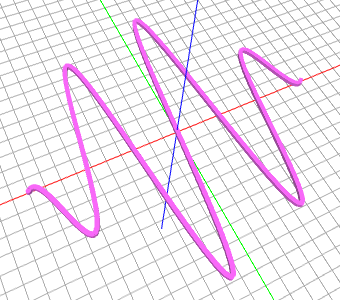
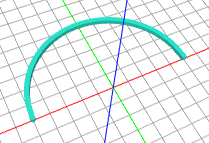
This is f(x) = sqrt(25 – x^2) in the interval (-5, 5):
And the last example: f(x) = 2 / (1 + x*2):